
Working from home has raised the importance of monitoring my internet connectivity. But a simple binary check won't suffice.
Even with a simple setup like I have at home - some switches and routers and an ISP modem - it's hard to identify which of the components is causing a QOS issue or even completely disconnects me from the internet.
Is it my ISP that's cutting service? Maybe the router is lagging behind? Should I change an RJ cable or switch providers?
A few colleagues have expressed interest in how I monitor my own connectivity using a simple RPi 1 B+, so I've decided to simply share.
Methodology
I monitor connectivity and QOS by pinging the network equipment.
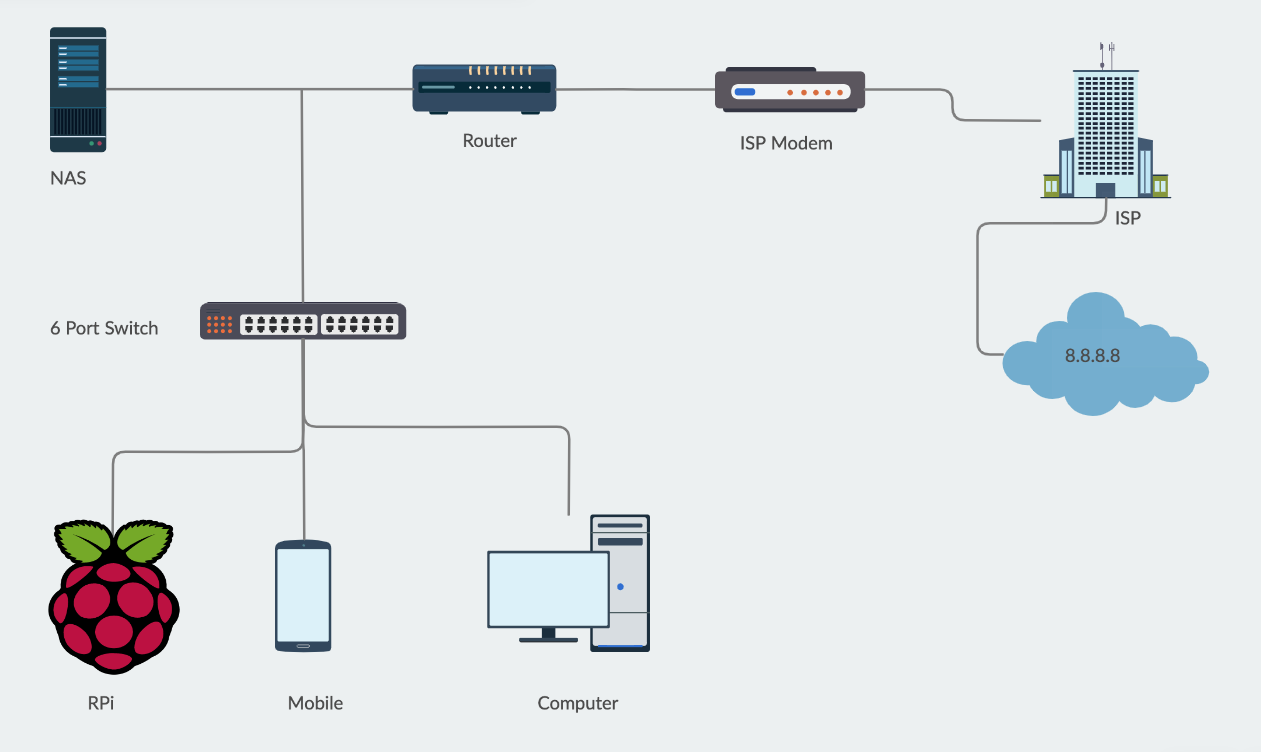
We want to monitor each and every hop (i.e. device) in our own home, as well as the ISPs gateway and a WAN IP or site to verify actual internet connectivity:
- The RPi is responsible for performing the pings, gathering the results, displaying data and raising alerts.
- We need to connect the RPi as far away as possible from the ISPs modem or gateway to the internet. This would allow us to calculate ping latency correctly (more on that later) as well as identify correct internet cutout reasons.
- So if you have a switch, connected to a router, connected to an ISP modem, you would connect your RPi to said switch.
- We also need to pick a stable WAN IP to validate internet access with. We need a stable service, such as Google's
8.8.8.8DNS. Reasoning being that if Google's DNS is down, we have bigger issues than our home connectivity.
For redundancy you could ping multiple WAN ips, such as CloudFlare's1.1.1.1and OpenDNS'208.67.222.222.
A typical home network setup might look something similar to this:
Installation
Currently the official installation script only supports armv7l and newer CPU architectures. Older architectures would have to resort to a package manager installation.
You can find out your RPi's architecture here, or follow according to type:
- armv6, armv7a -> RPi 1, RPi 2, RPi zero:
Install via apt:
$ sudo apt update
$ sudo apt install netdata -y
$ sudo systemctl start netdata
$ sudo systemctl enable netdata
- armv8 -> RPi 2 (v1.2), RPi 3, RPi 4 and beyond:
Follow this installation script guide.
Setting up Netdata
We need to make sure Netdata is binding to the right IP address.
Let's find out the RPi's IP address:
$ hostname -I | awk '{print $1}'
Then edit Netdata's configuration:
$ nano /etc/netdata/netdata.conf
Update the file with your correct Ip address:
[global]
        run as user = netdata
        web files owner = root
        web files group = root
        # Netdata is not designed to be exposed to potentially hostile
        # networks. See https://github.com/netdata/netdata/issues/164
        bind socket to IP = YOUR_IP_HERE
        dbengine multihost disk space = 512
We're not gonna deal with securing Netdata from outside access. You may read about it here.
Testing
Let's restart Netdata:
$ sudo systemctl restart netdata
$ sudo systemctl status netdata
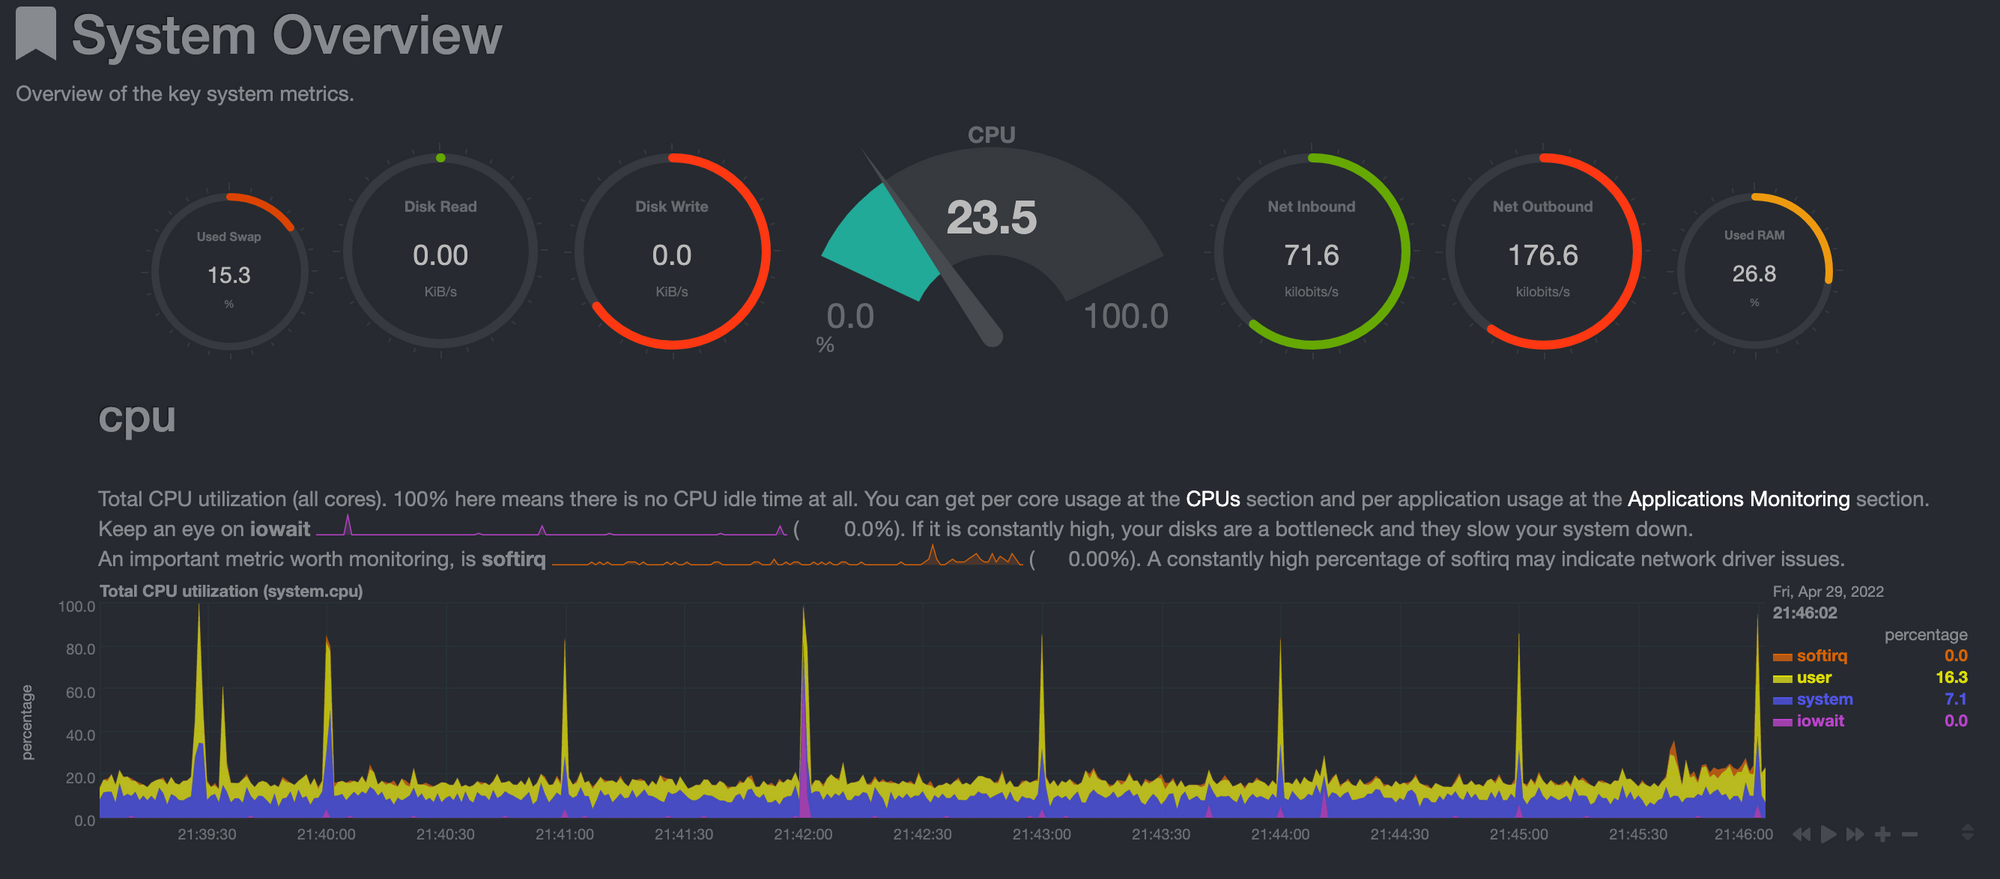
Now browse to http://YOUR_SERVER_IP_ADDRESS:19999 and you should see Netdata in action:
Setting up network monitoring with fping
<update date="29.01.2023">
Latest Netdata (1.37.x) requires fping 5.1.
While getting the testing version of fping 5.1 to work on my bulleseye 64bit RPi3B was easy, I couldn't get Netdata to trigger it. And no error was written to the logs either.
For now I had to reort to using the less capable go.d/ping.
</update>
It's important to remember that our goal is to monitor all the home network equipment as well as the internet gateway. We're gonna do this by having Netdata ping all hops periodically using fping.
Let's make sure fping is installed:
$ fping -v
fping: Version 4.2
fping: comments to david@schweikert.ch
If it's not available, simply install it:
$ sudo apt install -y fping
With Netdata, monitors are installed simply by copying templates from /usr/lib/netdata/ to /etc/netdata/. This is done using a built in script:
$ cd /etc/netdata/
$ ./edit-config fping.conf
$ ./edit-config health.d/fping.conf
Now edit the fping configuration:
$ nano fping.conf
We'll go over the setup line by line.
Here you'll need to enter the individual IP addresses of all of your home network equipment, as well as the WAN IP address we're using to validate internet access (8.8.8.8 in our case):
# a space separated list of hosts to fping
# we suggest to put names here and the IPs of these names in /etc/hosts

hosts="SWITCH_IP ROUTER_IP GATEWAY_IP 8.8.8.8"
We'll setup Netdata to ping all of these in bursts of 5 pings, each 3.3 minutes, and display information in a 10 minutes interval:
# The update frequency of the chart in minutes - the default is inherited from netdata

update_every=10

# The time in milliseconds (1 sec = 1000 ms) to ping the hosts
# by default 5 pings per host per iteration
# fping will not allow this to be below 20ms

ping_every=3333
The reason I've chosen these frequencies is that my trusty old RPi is already pre-occupied doing other things, and a higher rate proved to consume too many resources. With a dedicated RPi 3 you can reach almost a constant stream by setting update_every to 1 and ping_every to 20.
Let's restart Netdata:
$ sudo systemctl restart netdata
Wait 10 minutes and then check the fping section at http://YOUR_SERVER_IP_ADDRESS:19999/#menu_fping_submenu_8_8_8_8:
Monitoring your connection
Monitoring your connection is done via analyzing Netdata output and alarms.
Analyzing Netdata output
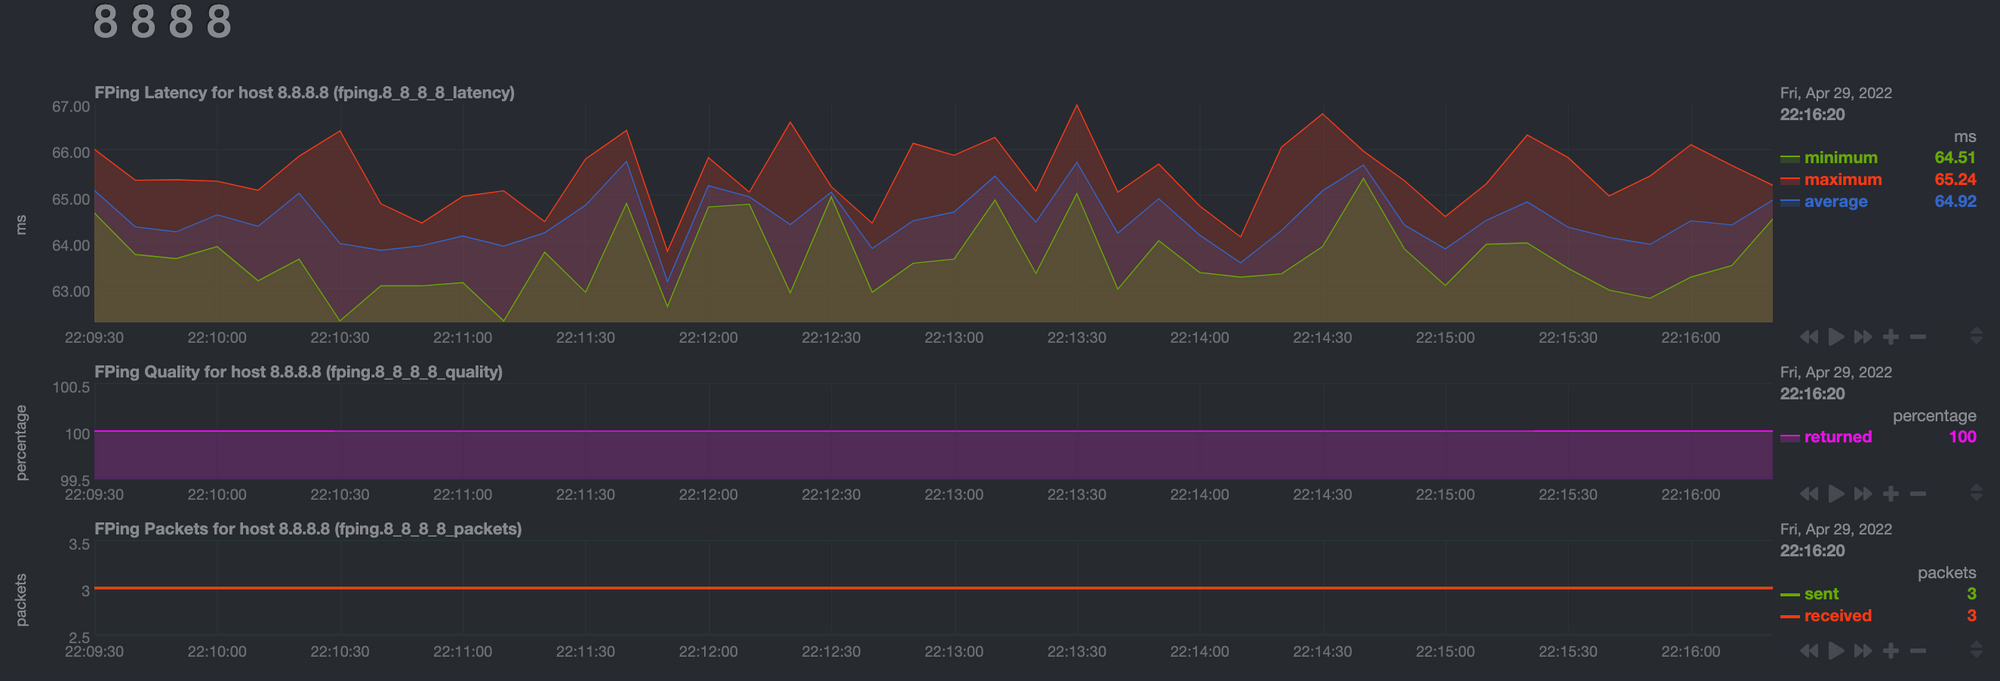
As observable in the image above, Netdata provides constant QOS data for each of your devices.
- You get latency ("ping") data, which naturally accumulates over hops. So you can easily identify which of your devices contributes the most latency.
My RPi to internet latency is ~65ms. - Ping loss data helps you identify which of your devices or gateways is the most problematic in terms of cutting your internet connection. Is it your home router or the ISPs modem? Netdata provides a quick and easy way to have a verdict.
Alarms
Alarms are logged events that appear after clicking the Alarms menu at the top. I usually switch straight to the logs tabs, which best TL;DRs the history of my connection:
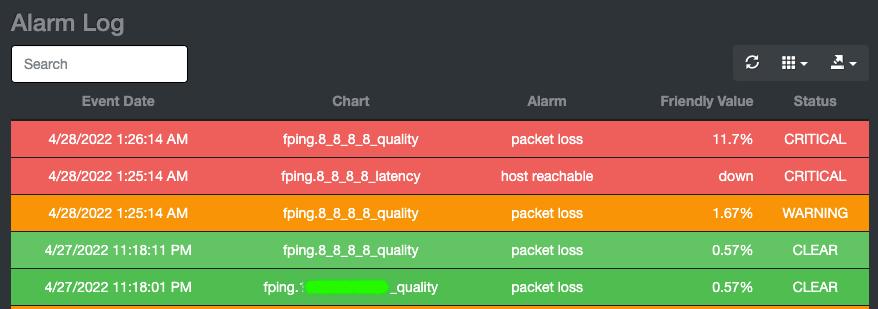
Looking at the log above, we can deduce a couple of insights:
- At 11:18:11PM, the ISPs modem had a small hiccup. This is evident by the fact that out of all of my devices, only it and the WAN site have started to exhibit ping loss (I've smudged its IP for security reasons).
To be more precise - this is the time in which the alarm was cleared, meaning regular service was restored. - At 1:25:14AM the connectivity from house was cut out completely. As evident, the ISPs modem as well as all of my own equipment were functioning correctly, so it must have been something entirely at the ISPs side.
At the time this image was taken, service has not been restored yet.
More Netdata insights
Prior to monitoring my connectivity, my RPi was used as a PiHole ad blocker and local DNS, and it still is. So I'm using Netdata to monitor this service health as well. All in all the RPi 1 has proven to be a capable machine.
Should I elaborate on the PiHole setup as well? Ping me in the comments please.